查看: 2030|回复: 0

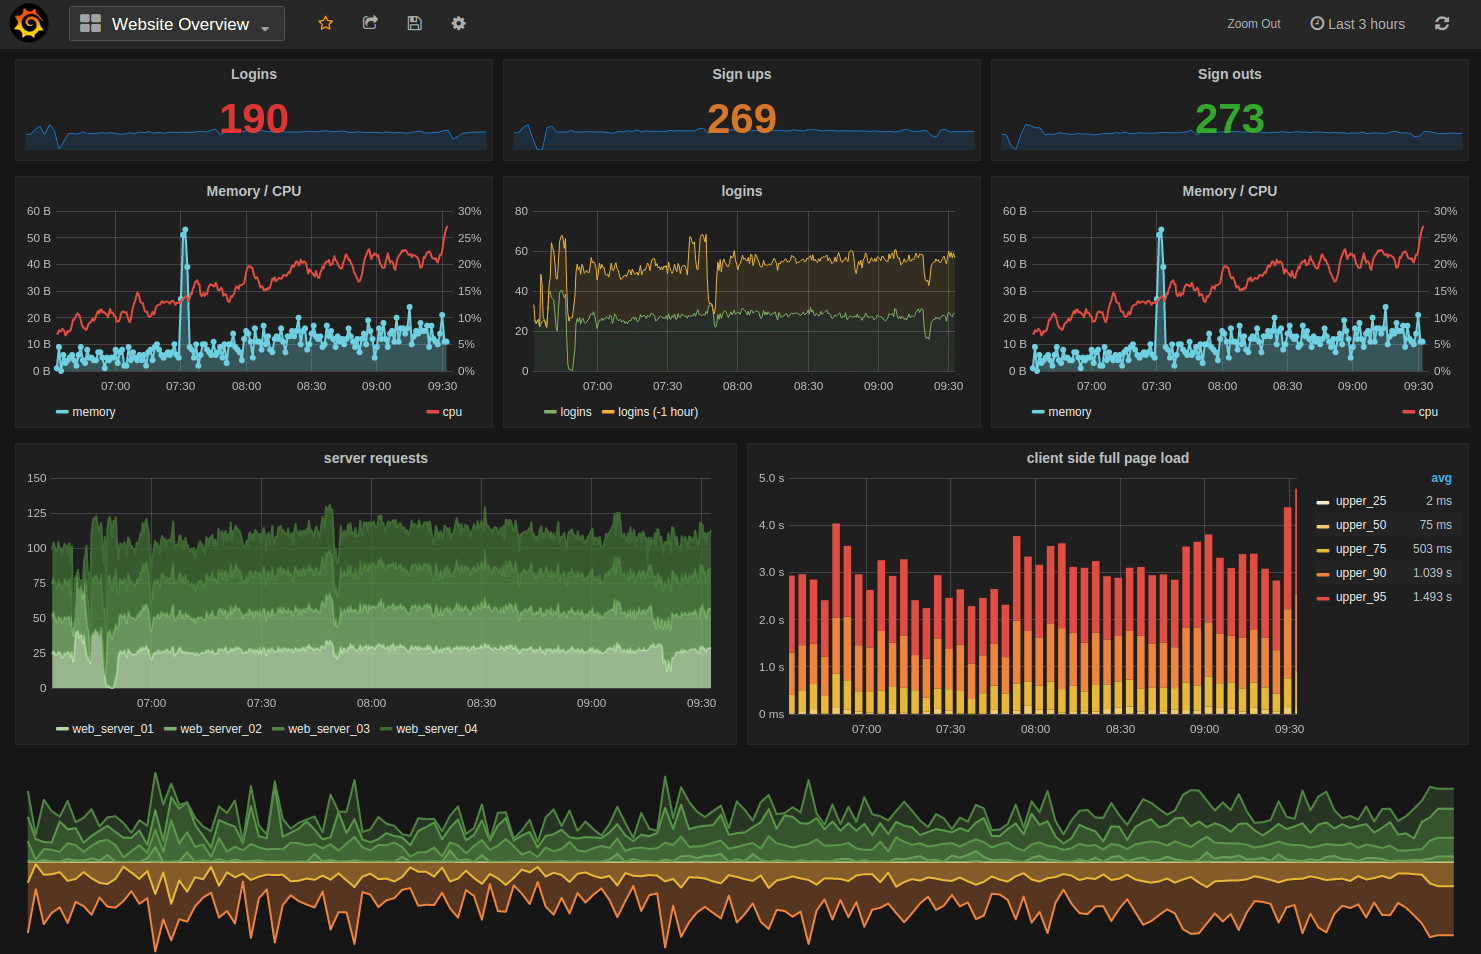
树莓派+Grafana制作出可以监控流量的图标盘

[复制链接]

该用户从未签到

发表于 2017-6-27 08:50:27 | 显示全部楼层 |阅读模式
分享到:

Grafana是一个优秀的开源图表系统,支持多种数据源,其中包括 InfluxDB和Prometheus

安装

<ol><li><code>export GOPATH=`pwd`go get github.com/grafana/grafana
cd $GOPATH/src/github.com/grafana/grafana
go run build.go setup              # (only needed once to install godep)
$GOPATH/bin/godep restore          # (will pull down all golang lib dependencies in your current GOPATH)
go run build.go build              # (or 'go build .')
编译好后会在bin目录下生成grafana-server和grafana-cli第二步需要生成资源文件,但是从源代码编译会遇到phantomjs-prebuild依赖包不存在arm版本的问题,可以直接下载windows版本解开里面的public目录到bin/public下
启动

在bin/conf下拷贝生成defaults.ini文件,执行./grafana-server即可
配置

用浏览器打开 https://<pi:ip>:3000 用帐号:admin,密码:admin 登录
首先要配置好Prometheus数据源:

下面是获取网络的上下行流量数据的采集脚本,通过Prometheus Push Gateway提交,可以每5分钟运行一次
<ol><li><code>DATA=`ifconfig eth1 | grep bytes | sed 's/:/ /g' | awk '{print "bytes_rx "$3"\nbytes_tx "$8}'`cat <<EOF | curl --data-binary @- https://pi3:9091/metrics/job/raspberrypi/instance/test
$DATA
EOF
然后在Grafana里可以按下图方式增加一个每小时网络流量的图表,increase(bytes_rx[1h])是Prometheus所支持的查询表达式。
回复

使用道具 举报

您需要登录后才可以回帖 注册/登录

本版积分规则

关闭

站长推荐上一条 /2 下一条

手机版|小黑屋|与非网

GMT+8, 2024-4-19 16:03 , Processed in 0.112922 second(s), 17 queries , MemCache On.

ICP经营许可证 苏B2-20140176  苏ICP备14012660号-2   苏州灵动帧格网络科技有限公司 版权所有.

苏公网安备 32059002001037号

Powered by Discuz! X3.4

Copyright © 2001-2020, Tencent Cloud.